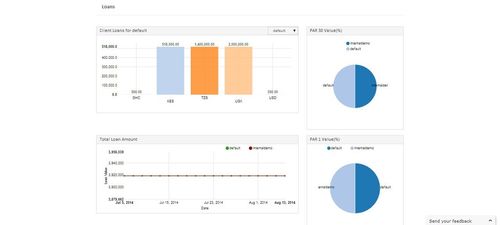
This page contains charts that display loan data.
| Graph Name | Type | Detail | User Actions (if applicable) |
|---|---|---|---|
Client Loans | Bar chart | Displays total client loans for each currency type in each tenant.This will display latest records in the database | User can select tenant separately. User can select tenants. |
PAR 30 Value(%) | Pie chart | Displays PAR 30(%) in each tenant. This will display latest records in the database | User can select tenants. |
PAR 1 Value(%) | Pie chart | Displays PAR 1(%) in each tenant. This will display latest records in the database | User can select tenants. |
| Total Loan Amount | Line chart | Displays total loan amount in each tenant. This will display two months of data in the database | User can select tenant separately. User can select tenants. |