/
Impact Portal Clients Page
Impact Portal Clients Page
- ChannaS
- Janiline Ebai
Owned by ChannaS
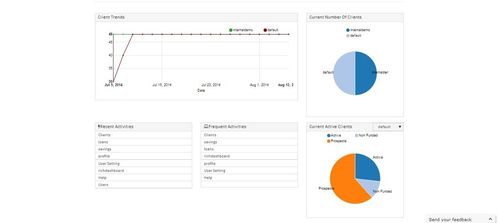
This page contains charts that display client data.
| Graph Name | Type | Detail | User Actions (if applicable) |
|---|---|---|---|
Current Number Of Clients | Pie chart | Displays total number of clients in each tenant. This will display latest records in the database | User can select tenants. |
Client Trends | Line chart | Displays total number of clients according to day in past two months in each tenant. | User can select tenants. |
Current Active Clients | Pie chart | Displays total number of clients according to client status for selected tenant. This will display latest records in the database | User can select tenant separately. User can select status type. |
, multiple selections available,
Related content
Client Impact Portal Savings Page
Client Impact Portal Savings Page
More like this
Client Impact Portal Loans Page
Client Impact Portal Loans Page
More like this